According to the documentation, the subclauses of the pivot_clause provide the following support:
- when using the pivot_for_clause you must explicitly list the values you want to pivot.
- when using the pivot_in_clause you can generate your pivot values dynamically from a subquery, however, that's only supported if you want XML as output.
In my case the list of values varied based on user input within an APEX 5 application and I did not want XML as output. I needed to stick with the pivot_for_clause option.
The application's purpose was to query electric meters by a single transformer and date range, allow users to pick all or subset of the meters fed by the transformer, and display their aggregated 15 minute KW graphically. This allows the end user to see if a transfomer's load is under its rated capacity.
 |
| Transformer Load Based on Meter Aggregation |
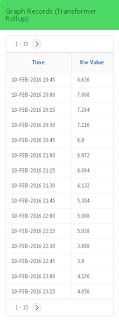
Graphical representation was not enough as they wanted tabular data that they could interact with and download to csv as well. It was simple enough to add an interactive report below the chart to meet this requirement.
The last request was to allow the user to view the un-aggregated tabular data as a pivot table (on the same page) so that individual meter names became columns and their KW for a time interval became the row value. APEX 5 introduced the capability to allow users to pivot interactive reports, however you have to explicitly select your columns to include. This is a limitation of the underlying pivot function, unless you want your output as XML.
Using the APEX 5 OOTB pivot capability approach would have been fine except the next time different inputs were entered the returned meters would be different and the pivot configuration would be broken and have to be redone. I needed a better way to handle dynamic lists of returned meters.
I decided to use a classic report region for this task as they allow you to generate a report based on the sql returned by a function. In other words, they allow you to generate your sql on the fly.
What this allowed me to do is capture the meter names input by the end user and dynamically build my pivot clause (pivot_for_clause) at runtime. Here's my function:
DECLARE
--a place to store the final sql
l_retval VARCHAR2 (32767);
--a place to store the PIVOT clause columns based on user input
l_csv_meter_list VARCHAR2 (32767);
BEGIN
l_csv_meter_list := '''' || REPLACE ( :P1_METERS, ':', ''',''') || ''''; --List of meters the users selected
l_retval :=
'SELECT * from (
SELECT meter.udc_id meter, lp.local_interval_time TIME,
lp.lp_value*4 KW_VALUE
FROM emapp.lookup_mv_sdps sdp,
emapp.lookup_mv_meters meter,
emapp.lookup_mv_channels1 channel,
emapp.lp_intervals lp
WHERE sdp.premise_id IN (SELECT premid
FROM AMFC.PREM_TRANSFORMER_REL
WHERE xfmrswitchpoint = :P1_TRANSFORMER)
AND SDP.CFG_TYPE_CD = ''Electric''
and sdp.meter_id=meter.meter_id
AND SDP.SDP_ID = CHANNEL.SDP_ID
and meter.meter_id=channel.meter_id
AND CHANNEL.CHANNEL_TYPE = ''Interval Data''
AND channel.logical_channel_no = 1
AND channel.channel_id = lp.channel_id
AND lp.utc_interval_time BETWEEN amfc.to_utc_time (sdp.start_date)
AND amfc.to_utc_time (
NVL (sdp.end_date, SYSDATE))
AND lp.utc_interval_time BETWEEN amfc.to_utc_time (channel.start_date)
AND amfc.to_utc_time (
NVL (channel.end_date, SYSDATE))
AND lp.utc_interval_time BETWEEN amfc.to_utc_time(:P1_START_DATE) AND amfc.to_utc_time(:P1_END_DATE)
and instr(:P1_METERS,meter.udc_id)>0)
PIVOT (SUM(KW_VALUE) As KW FOR (meter) IN ('
|| l_csv_meter_list --APPEND DYNAMIC PIVOT CLAUSE HERE
|| '))';
RETURN l_retval; --RETURN dynamic sql statement to classic report
END;
Here's the classic report result:
 |
| Pivot Result |
Here's the final page result:
 |
| Final Result - aggregated graph, aggregated tabular, and raw pivoted |


